PZU shares were first traded on the Warsaw Stock Exchange on 12 May 2010. Since its IPO, the company has been included in the WIG20, WIG, WIG30, WIG-Poland, and WIGdiv indexes. Since 2012, PZU shares have been also included in the RESPECT sustainable development index (presence confirmed on 14 December 2016).
Stock split
On 30 November 2015, PZU split its shares, the operation consisted in decreasing the nominal value of shares from PLN 1 to PLN 0.1. The operation was purely technical (i.e. without any influence on share capital). Following the split, the share price decreased 10 times and the number of shares increased 10 times. The main objective of the split was to make the PZU shares more accessible to individual investors as well as to diversify the shareholder structure.
WSE indexes
In 2016, the most important Polish index, WIG20, fluctuated in the range of 1674-1999 points, closing the final session of the year at a level close to the year’s maximum, i.e. 1,947 points (up by 4.8% year-on-year). The broad WIG market index closed 2016 by recording 51,754 points, up by 11.4% year-on-year, thus confirming the greater strength of small and medium enterprises quoted on WSE (mWIG gained 18.2% year-on-year). The RESPECT Index also presented high dynamics and closed at 10.9% higher than in 2015.
PZU share prices
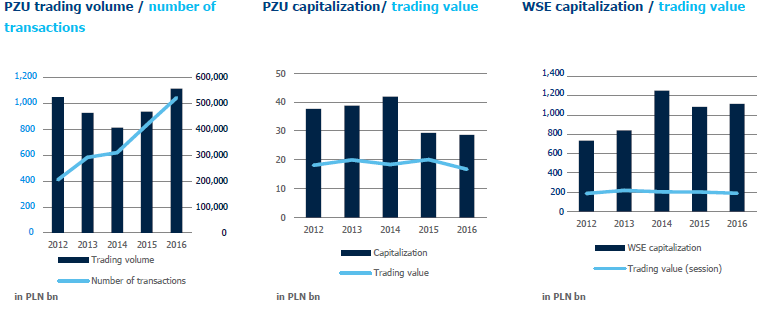
With capitalization amounting to PLN 28.7 billion, at the end of 2016 PZU was the sixth company with regard to capitalization of domestic companies
In 2016, PZU shares remained among the top most liquid companies on WSE. With capitalization amounting to PLN 28.7 billion, at the end of 2016 PZU was the sixth company with regard to capitalization of domestic companies. PZU’s share in the trading of the whole exchange reached 8.9% (4th place).
In 2016, the maximum PZU share price (calculated at session end) amounted to PLN 36.30. The price reached its bottom soon after the dividend (PLN 2.08 per share) from 2015 profit was cut off from the share price on 30 September 2016. The price per share at the end of this session was PLN 24.38, a historical low since PZU’s debut on the exchange.
Min/max PZU share prices following the session end in the years 2010-2016

* Share prices from 12 May 2010 (PZU’s IPO on WSE).
Source: Reuters
In the first half of 2015, WIG20 experienced a downward trend, which entailed a decline in the price of PZU. There was a strong attempt at reversing this trend in the fourth quarter of 2016, which saw PZU grow by 36.2% quarter-on- quarter, i.e. considerably more than WIG20 and WIG, which rose appropriately by 13.9% and 9.9% quarter-on-quarter. Consequentially, the volatility of PZU share prices in all of 2016 (recognized as the quotient of the standard deviation from the period’s average price) was 10.3%, only 68 bps lower than in 2015. In 2016, PZU’s systematic risk expressed by the Beta coefficient (PZU price compared with WIG for daily changes) was 1.18 (1.07 in 2015). At the last session of 2016, WIG20 recorded growth of 4.8% year-on-year while PZU’s shares were quoted at a similar level to that of the end of 2015, i.e. PLN 33.21 (-2.4% year-on-year).
The total rate of return for shareholders in 2016 reached 3.7% (for comparison, its value at the end of 2015 was negative: -23.8%). The dividend rate (calculated in relation to the share price at the end of 2016, i.e. PLN 33.21) was 6.26% (PLN 2.08 of dividend per share), which is almost twice as high as the average for WIG20 and WIG Banks, which were at appropriately 2.8% and 3.1%1.
In 2016, PZU’s shares retained high liquidity. The average spread of the year reached only 9 bps (the average for the top 20 companies with the biggest trading value was 18 bps). The average number of transactions involving PZU shares per session was 4,169 (a 25.3% increase year-on-year). The highest trading volume, i.e. 11.5 million units, was recorded on 24 August 2016 (with 1.1% growth of the share price at the end of the session), i.e. on the day of announcement of the PZU Group Strategy for the years 2016–2020. For comparison purposes, the highest trading value in 2015 (at a single session) did exceed 7.7 million share units. The announcement of the dividend policy (4 October 2016) was accompanied by strong emotions as well. On 4–5 October 2016, the total turnover reached 16.5 million shares and the price rose by 11.3% in total.
In 2016, investors discounted the uncertainty associated with PZU’s potential involvement in the consolidation of assets of the banking sector in Poland and the possible maintenance of attractive dividends from PZU. The anxiety went down when PZU announced its dividend policy (4 October) CHAPTER 8.7 PZU GROUP’s CAPITAL AND DIVIDEND POLICY and its purchase of a share package of Bank Pekao (8 December) CHAPTER 4.5 PZU GROUP’s DIRECTIONS OF DEVELOPMENT / BANKING. The PZU Management Board declared that it wanted to continue to provide its shareholders with an attractive stream of rising dividends and that it had no plans for changes in Bank Pekao, neither in the Management Board nor in the Bank’s dividend policy and strategy. After the exchange session on 8 December, the value of PZU grew by PLN 716.7 million (+2,6%) at a high trading volume of 10.5 million shares.
Factors influencing the exchange rate of PZU shares in 2016

Codes Quick Response (QR) for online transmission
 for online transmission")
| PZU share statistics | 2016 | 2015 | 2014 | 2013 | 2012 |
|---|---|---|---|---|---|
| Maximum rate of shares (PLN) | 36.30 | 50.87 | 51.10 | 47.79 | 43.72 |
| Minimum rate of shares (PLN) | 24.38 | 31.43 | 40.90 | 38.50 | 29.21 |
| Exchange rate at the last session of the year (PLN) | 33.21 | 34.02 | 48.60 | 44.90 | 43.70 |
| Average rate per session (PLN) | 30.76 | 43.72 | 45.22 | 43.22 | 34.61 |
| Value of the volume (PLN million) | 16,754.98 | 20,144.56 | 18,400.72 | 19,970.38 | 18,152.22 |
| Average value of the volume per session (PLN million) | 66.8 | 80.3 | 73.9 | 80.9 | 73.2 |
| Number of transactions (item) | 1,046,398 | 835,471 | 621,224 | 585,205 | 411,635 |
| Average number of transactions per session | 4,169 | 3,329 | 2,495 | 2,369 | 1,660 |
| Trading volume | 558,496,833.0 | 470,048,842.0 | 407,247,220.0 | 464,899,980.0 | 525,648,380.0 |
| Average trading volume per session (item) | 2,225,086.9 | 1,872,704.5 | 1,635,531.0 | 1,882,186.2 | 2,119,549.9 |
| Capitalization at the end of the period (PLN million) | 28,677.6 | 29,377.1 | 41,967.2 | 38,767.9 | 37,736.0 |
Ratios
As at the end of 2016, the capitalization of WSE companies rose by 7.8% year-on-year to PLN 557 billion (including 19 new entities that had their IPOs lunched in 2016). The P/E ratio for the banking industry (the most adequate comparison for PZU on WSE) was 11.7 while the P/BV was 0.762. PZU’s P/E ratio was 14.7 and its P/BV was 2.2.
| Capital market ratios for PZU shares* | 2016 | 2015 | 2014 | 2013 | 2012 |
|---|---|---|---|---|---|
| P/BV Market price per share / book value per share |
2.20 | 2.27 | 3.19 | 2.95 | 2.64 |
| BVPS Book value per share |
15.07 | 14.97 | 15.25 | 15.20 | 16.52 |
| P/E Price per share / profit per share |
14.73 | 12.54 | 14.14 | 11.77 | 11.60 |
| EPS (PLN) Net profits (losses) of owners / number of shares |
2.25 | 2.71 | 3.44 | 3.82 | 3.77 |
* calculation based on PZU Group’s data (according to IFRS)
1 2016 WSE Statistical Bulletin
2 http://www.gpw.pl/analizy_i_statystyki